Improving OpenGL Performance
The in game performance of OpenRW was worse than it should be. I investigated why and made great performance improvements on an important platform: laptop GPUs. This post covers the investgation and the changes made.
Testing Performance
OpenRW has a “test mode” that spawns several vehicles and pick-ups in a central location. Performance in this spot isn’t great, so I started there. I took samples from two angles, looking at the horizon and looking at the ground. There was quite a difference in performance between the two situations.
| View | Frame time | Draws |
|---|---|---|
| Ground | 7.3 ms | 191 |
| Horizon | 17.7 ms | 1035 |
CPU Profiling with Perf
To try and understand what is happening I began profiling with perf.
I ran perf in the following way, which spawns sleep but records samples from
rwgame (the process name for OpenRW), an easy way to record for a fixed length of time.
$ perf record -p $(pidof rwgame) sleep 15
Once the process exits, perf record writes out a file containing the samples it took.
The data can be viewed in the terminal by running perf report. I recorded a
few sessions looking at the horizon, and the report was roughly the same each time.
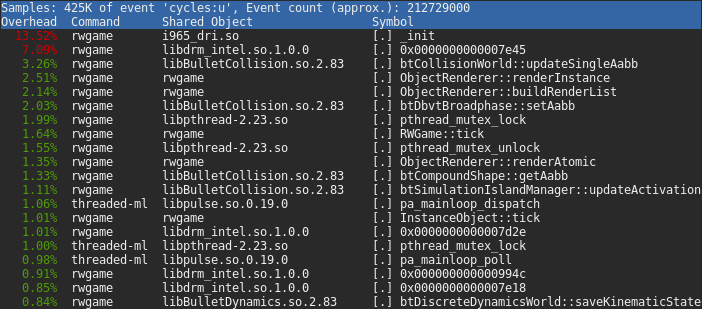
The top two most sampled methods are within the Intel GPU driver, followed by
bullet (I’m not sure what causes the odd symbol names like 0x0000000000007e45).
It is clear that a lot of time is spent in the driver, more than I would expect
for such a simple scene.
Since the CPU profile shows a lot of time in the driver, I suspected that the OpenGL usage was far from optimal. To see what was happening between OpenRW and the driver, I needed to take a look at the GL calls. There’s some good tools for this these days: RenderDoc and apitrace being the most portable.
OpenGL debugging with apitrace
OpenRW doesn’t do anything complicated so using apitrace to inspect the raw OpenGL calls is easy enough. I captured a trace of the Horizon scene like so:
$ apitrace trace -o test_mode.trace ./rwgame/rwgame -t
The trace can be viewed with the GUI trace viewer QApitrace, or inspected with command line tools.
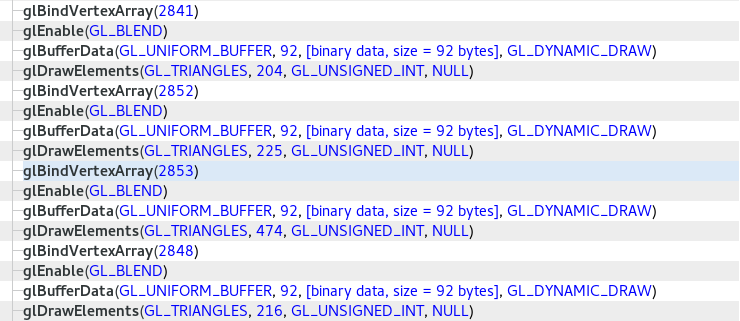
This trace shows a couple of issues:
Enable(GL_BLEND)is called repeatedly to no effect: a bug.BufferDatais called for each draw to upload data: expensive.- Each draw requires a new VAO be bound: expensive
State Caching
Calling Enable(GL_BLEND) repeatedly isn’t going to do us any favours,
and could be obscuring some bugs elsewhere. This is the first thing I decided to
fix as it shouldn’t have been happening in the first place. The rendering system
is intended to cache the set state and only change it if we have to, but the
method responsible, OpenGLRenderer::setBlend(bool) didn’t even check if we
were trying to turn it on, it just called glEnable(GL_BLEND) no matter what.
I corrected that and immediatley a few things broke:
The issue was just down to the map and particle system not enabling the blending
state, even though they relied on it. This was overlooked previously because
the bug in setBlend left the state enabled. After updating those call sites
to set the correct state, it was fixed.
Buffer Updates
The next issue on the list is the per-draw data updates. Calling BufferData
for each draw is expensive. I consulted the “Approaching Zero Driver Overhead”
presentation for guidance, and decided to implement a simple solution:
- Determine the largest UBO size available from the driver.
- Decide how many draw calls worth of data can fit inside a single UBO.
- Then, Per-Draw:
- If we have run out of space in our UBO, reset the counter and get new storage with
BufferData. - use
MapBufferwith the offset for our current draw data, copy the data into the buffer and unmap. - Bind the UBO at the offset for the current draw, and Draw.
- If we have run out of space in our UBO, reset the counter and get new storage with
This isn’t as extreme as using persistent mapping like the AZDO presentation suggests, but should at least avoid some of the pressure of re-allocating storage for each draw that the driver is still trying to use. It also has the benefit of not requiring OpenGL 4.0, unlike persistent mapping.
The result is a significant increase in performance, slicing several milliseconds off most frames. Revisiting the original test shows what impact the buffer update strategy has, a pretty reasonable 30% improvement.
| View | Frame time | Draws |
|---|---|---|
| Ground | 6.7 ms | 250 |
| Horizon | 12.2 ms | 1063 |
What’s Next
While 30% is a modest improvement in performance, there is more that can be gained by applying some further changes to how rendering works:
- Allocating one buffer for multiple vertex and index data, to reduce buffer changes.
- Copying draw data to buffers in larger batches.
But these can wait. Performance has improved enough already to make OpenRW playable so it is more important to fix gameplay issues and make sure it’s actually worth playing.